Daily Satta Matka Charts – Updated Result
September 15, 2025 · By Prabhat M.
There is a reason experienced Satta Matka followers check the daily chart before they do anything else: a single well-organised table tells you more about how the markets are moving than any rumour or tip ever could. Each row is a record of what was actually declared, session by session, and reading those rows in order is how the game stops feeling like guesswork and starts feeling like something you can genuinely follow. This guide explains how to read a daily chart properly and what to look for in fast, updated results.
What a Satta Matka Chart Really Shows
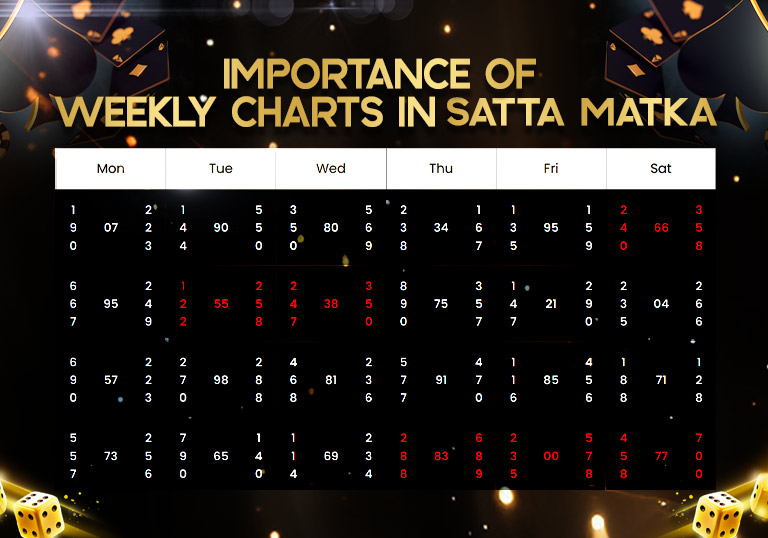
A Satta Matka chart is an ongoing log of declared outcomes. It lists the numbers for each market, from familiar names like Kalyan and Prabhat to Rajdhani Night and Jyot, laid out so you can see how results unfold across days and weeks. Reading these tables is the first real step toward understanding the rhythm of any market.
Every chart entry generally records three key details:
- Open Number – the figure declared at the start of a session.
- Close Number – the figure declared when the session ends.
- Jodi or Panna – the paired or three-figure numbers that complete the result.
Scanning a single day's chart tells you exactly what came up in the morning, evening and night rounds across each market you follow.
Reading a Sample Row
Suppose a market's row for a given day reads as open 138-2, close 7-160. Here is how to unpack it:
- 138 is the opening panna (the three-figure group), and its single-digit total gives the open number 2.
- 7 is the close number, with 160 as its closing panna.
- Put the open and close digits together, 2 and 7, and the Jodi is 27.
Once you can read one row this way, every other row on the chart becomes equally clear, and an entire month of history opens up to you at a glance.
Why Following the Daily Chart Helps
Many regular followers treat the chart as a study tool rather than just a scoreboard. Looking at it consistently can help you in several ways:
- Noticing how certain numbers or pairs recur across sessions.
- Forming more thoughtful, informed guesses instead of purely random ones.
- Drawing lessons from earlier outcomes you have already seen.
- Building a feel for each market's pace and timing.
Some seasoned followers even keep their own notebooks of past charts to compare trends. The game remains ruled by chance, but reviewing the data gives you a clearer picture of how things have been moving.
How to Check Updated Results: Step by Step
- Open the homepage on your phone or desktop.
- Choose the market you want from the list of names.
- Read today's row first for the latest open and close figures.
- Scroll back through earlier days to compare recent sessions.
- Confirm the timing so you know whether a number is final or still pending for the session.
Building a Simple Daily Reading Habit
The followers who get the most out of a chart are usually the ones with a small, repeatable routine rather than a clever trick. A habit that many find useful looks like this. First, glance at the markets in the order their sessions run through the day, so the morning markets are read before the night ones. Second, note the Jodi that landed for each, not just the open or close on its own, because the pair is what most charts are organised around. Third, keep a tiny log, even a few lines in a notebook, recording the date and the Jodi for the one or two markets you actually care about. Within a couple of weeks that log becomes far more informative than any single day's table, because you start to see which pairs have appeared recently and how spread out the results have been.
None of this changes the fact that the game is ruled by chance, and it is important to be honest about that. A reading habit does not give you a forecast; what it gives you is familiarity. You stop being surprised by the layout, you read a row in seconds, and you can tell at a glance whether a number is freshly declared or still pending. That comfort is the real benefit of following the daily chart closely, and it is exactly the kind of steady, low-pressure approach that keeps the whole thing enjoyable.
Markets Covered
Charts are published for all the leading Matka markets, including:
- Kalyan Matka
- Prabhat Night
- Rajdhani Night
- Main Bazar
- Jyot Bazar
- And several more
Frequently Asked Questions
How often are the charts updated? The charts are refreshed as soon as each number is declared for its session, so today's figures appear without a long wait.
What is the difference between Jodi and Panna on a chart? The Jodi is the two-digit pair formed by the open and close, while the Panna is the three-figure group sitting behind each single digit.
Can reading the chart predict the next result? No. The chart is a record of past outcomes and a study aid; it cannot forecast a future result, because each session is independent and ruled by chance.
A Final Word
Satta Matka has long been followed for its excitement and curiosity, and the daily chart is the most reliable way to engage with it thoughtfully. Read the rows carefully, understand the open, close, Jodi and panna, and treat the data as information rather than a crystal ball. For today's outcome or to revisit older records, check the live results and updated charts on Tiger Prabhat World.
About the author
Written by the Tiger Prabhat editorial team — players and result-watchers who have followed Prabhat and Satta Matka markets for years, bringing you fast, accurate results and clear guides.