Kalyan Jodi Chart Explained: How It Works
August 2, 2024 · By Prabhat M.

What Is a Kalyan Jodi Chart?
"Jodi" means a pair, so a Kalyan Jodi chart is a structured log of the two-digit numbers that have appeared in the Kalyan game over time. Each jodi is formed by joining the open ank and the close ank for a session. Laid out as a grid, the chart lets you scan back across dates and see which pairs have surfaced and when. Where a single result tells you almost nothing, a full chart shows the texture of a market over weeks and months.
How a Jodi Is Formed
Before the grid makes sense, it helps to see where one jodi comes from. Suppose for a given day:
- The open panel is 136. Adding the digits: 1 + 3 + 6 = 10, drop the tens, the open ank is 0.
- The close panel is 478. Adding the digits: 4 + 7 + 8 = 19, drop the tens, the close ank is 9.
- Place them side by side and the day's jodi is 09.
That single value, 09, is one cell in the chart. Repeat this every day and you build the running history the grid displays.
How the Chart Is Laid Out
Rows, Columns and Dates
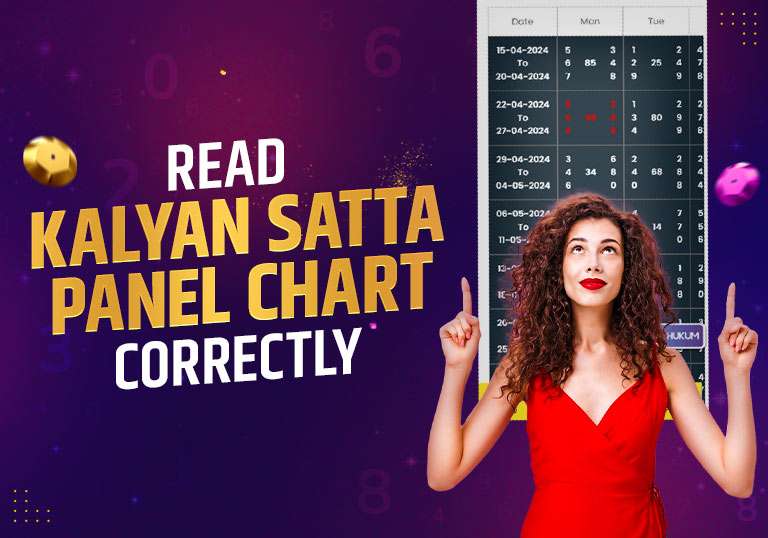
- Weeks down the side: Most Kalyan Jodi charts run a week per row, with each row labelled by its start date.
- Days across the top: Columns represent the days of the week, so each cell ties a jodi to a specific date.
- One pair per cell: Reading a single cell gives you that day's jodi; reading a column down shows how, say, every Monday has landed over time.
Spotting Repeats
- Recurring pairs: The grid makes it easy to see which jodis have shown up more than once. A frequently seen pair is sometimes called a "warm" jodi in everyday talk.
- Counting occurrences: By tallying how often a pair appears across the visible range, followers form a rough sense of which numbers have been active lately.
How Players Actually Read It
- Fix your window. Decide whether you are reading the last month or the last quarter. A defined range keeps the patterns readable instead of overwhelming.
- Read columns for weekday habits. Some followers believe a market behaves a little differently by weekday, so they scan a single column top to bottom.
- Read rows for momentum. Reading a week across shows the recent run of jodis and where the market has been swinging.
- Mark repeats, do not chase them. Note pairs that recur, but treat the count as background information rather than a signal to act on.
- Cross-check with the panel chart. Since each jodi comes from two panels, comparing the two charts gives a fuller picture than either alone.
Why the Jodi Chart Beats Reading Single Results
It is worth being clear about what a Jodi chart adds over simply checking a day's result. A single jodi, say 09, is just a fact about one day. The chart turns that fact into context. Looking at the grid, you might notice that 09 has appeared three times in two months, or that the close ank has leaned toward higher digits for several weeks running, or that a particular weekday column has been unusually varied. None of that is visible from one result. The chart does not make the next jodi any more knowable, but it does let you talk about the market in terms of its history rather than its last single outcome, which is why followers treat it as study material rather than a scorecard.
Things to Keep in Mind
- No certainty. A chart only reflects what has already happened. It cannot predict what comes next, and the game stays unpredictable by nature.
- Stay measured. Use the chart as a reading aid for understanding history, and approach the game thoughtfully and within sensible limits.
- Patterns are descriptions, not signals. A streak or a repeat describes the past; it places no obligation on the future, however convincing it looks on the grid.
Frequently Asked Questions
What does a jodi like "09" actually mean?
It is the two-digit pair made by joining the open ank and the close ank for a day. The first digit comes from reducing the open panel, the second from reducing the close panel. Together they form one cell in the Jodi chart.
Does a "warm" jodi mean it will appear again soon?
No. A frequently seen pair is just a pair that has appeared often in the recorded range. Past frequency does not influence the next draw. The chart describes history; it does not forecast it.
How far back should I read the chart?
A month or a quarter is usually plenty. A short, defined window keeps genuine patterns visible, whereas reading a year at once tends to bury any clear observation under noise.
Final Thoughts
The Kalyan Jodi chart is a handy reference for anyone wanting to understand how the Kalyan game has unfolded over time. Seeing where each pair comes from, reading rows and columns with a purpose, and noticing repeats without chasing them turns the grid from a wall of numbers into a readable history. Just remember that no chart guarantees an outcome. Used as a learning tool, it simply demystifies the structure behind the numbers.
About the author
Written by the Tiger Prabhat editorial team — players and result-watchers who have followed Prabhat and Satta Matka markets for years, bringing you fast, accurate results and clear guides.