Why Panel Charts Shape How Satta Players Decide
September 1, 2025 · By Prabhat M.

What a Panel Chart Actually Records
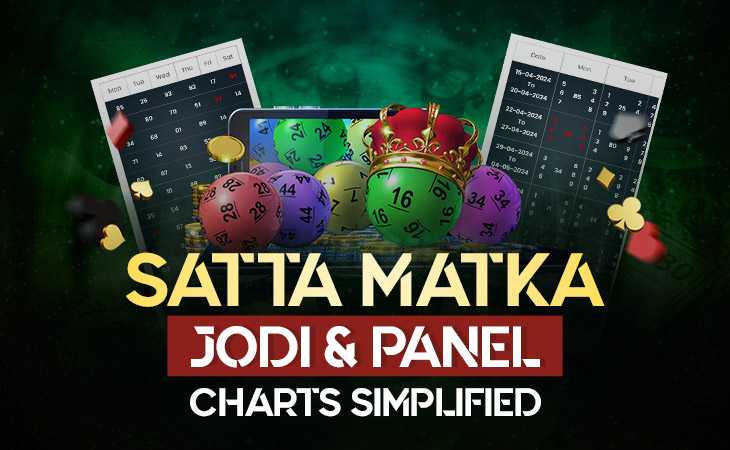
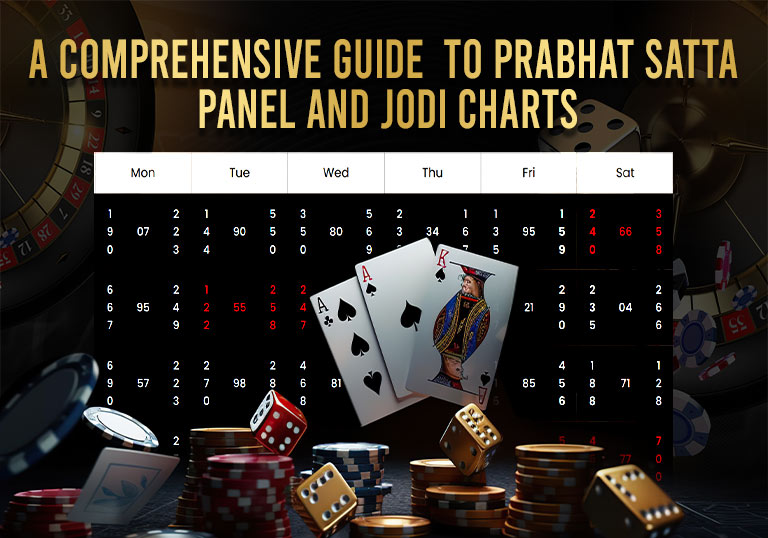
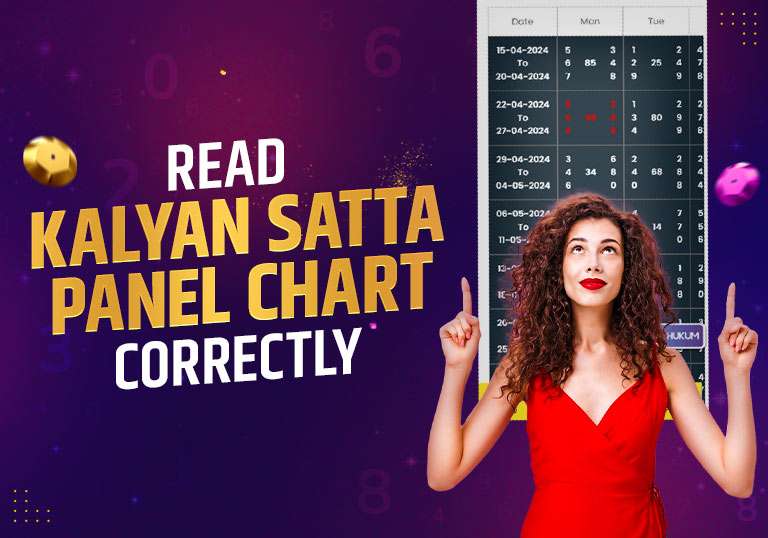
A panel chart is an organised history of past Matka outcomes, set out date by date so nothing has to live in your head. Each market keeps its own chart, so Prabhat, Kalyan, Rajdhani, Milan and Prabhat Night each have a separate log of what was declared. A panel itself is the three-digit figure (the panna) that opens or closes a session, and the chart lines these up so you can read across days and down weeks.
The value is in the layout. A single result on its own tells you almost nothing. Two hundred results stacked in order start to show texture: which digits crop up often, which pairs have gone quiet, where a market has been swinging high or low.
A Quick Worked Example
Imagine five days of Kalyan close panels laid out as a chart:
- Monday: 128 (digit total 1+2+8 = 11, ank 1)
- Tuesday: 370 (3+7+0 = 10, ank 0)
- Wednesday: 489 (4+8+9 = 21, ank 1)
- Thursday: 155 (1+5+5 = 11, ank 1)
- Friday: 226 (2+2+6 = 10, ank 0)
Read as raw numbers, those five panels look random. Read through the chart, a follower notices the closing ank has bounced between 0 and 1 all week, and that the digit 1 keeps appearing inside the panels themselves. That is the kind of small observation a panel chart hands you that a single day's result never could. It does not predict Saturday, but it gives you something concrete to think about.
Why Players Keep Coming Back to It
- It turns scattered results into patterns. Repeated panels, recurring anks, and dry spells only become visible when results sit side by side over time.
- It works as a reference book. Instead of trusting memory, you can scan weeks of history before deciding anything.
- It replaces guessing with awareness. No chart guarantees an outcome, but studying one is plainly more informed than picking digits at random.
- It is always within reach. Online charts update the moment a result is declared, so there is no waiting on a printed sheet.
- It is a shared language. Beginners and veterans both speak in panels and anks, so the chart is common ground for the whole community.
The Main Types of Panel Chart
- Single Panel Chart – shows one panel outcome per slot, the simplest view for tracking open or close figures.
- Double Panel Chart – lays the open and close panels side by side so you read both halves of a session together.
- Jodi + Panel Chart – pairs the two-digit jodi with its panels in one view, useful for followers who track pairs and pannas at the same time.
Each format answers a different question, and most regulars move between them depending on what they are studying that day.
How to Read a Panel Chart Without Drowning in It
- Pick one market. Do not try to read Kalyan, Prabhat and Rajdhani in one sitting. Stay with a single chart until its rhythm feels familiar.
- Read in rows first. Move day by day to see the recent direction before you start hunting for older patterns.
- Reduce panels to anks. Add the three digits and take the last digit. Tracking the ank often reveals trends the full panel hides.
- Note repeats, do not chase them. A panel that appeared twice is worth noticing, but it is information, not a promise.
- Set a window. Two to four weeks is usually enough context. Going back months can bury a clear signal under noise.
Frequently Asked Questions
Can a panel chart predict the next result?
No. A chart only records what has already happened. It is a study tool that helps you understand a market's history and behaviour, not a forecast. Any number game stays unpredictable by nature, and treating the chart as a guarantee misses the point of it.
What is the difference between a panel and an ank?
A panel (panna) is the three-digit figure declared for a session, such as 128. The ank is the single digit you get by adding those three numbers and keeping the last digit, so 128 gives an ank of 1. The chart often shows both so you can study them together.
How often should I check the chart?
Most regulars glance at it once a day, around the time results are declared. Because online charts refresh in real time, a quick daily look is enough to stay current without obsessing over every entry.
Final Thoughts
Satta Matka mixes fortune with a little skill, and luck is the part no one controls. What the panel chart offers is the other half: genuine knowledge of how a market has moved, and a calmer way to approach the next session. It preserves the past, surfaces the patterns inside it, and supports steadier day-to-day decisions. That quiet, dependable value is exactly why the chart stays a fixture for anyone serious about the game. Approach it as a study habit, keep your limits sensible, and remember the chart explains history rather than promising the future. If you want the mechanics spelled out from the ground up, our complete Prabhat panel and Jodi chart guide covers exactly how each chart is read.
About the author
Written by the Tiger Prabhat editorial team — players and result-watchers who have followed Prabhat and Satta Matka markets for years, bringing you fast, accurate results and clear guides.